Africa has experienced the fastest-growing demand for rice in the world over the past decade, making rice remarkable economic and social importance. However, compared to other rice-growing regions, Africa's rice yields are among the lowest, with imports meeting most of the demand. Yield improvement can be achieved by adjusting elements of the cropping system, such as planting date and density. Therefore, this experiment aims to determine the proper seedling age and optimum planting density of NERICA 10 for maximum grain and straw yields as well as high net profit. The experiment was conducted using a factorial randomized block design with three replications. Seedling age of 21 and 28 days after sowing (DAS) and planting density of 14.5, 20.0, and 25.6 hills/m2 were used as factors. Plant length, stem number, leaf color, heading date, paddy yield, yield components, and straw yield were measured. Data were analyzed using Microsoft Excel and JMP (ver.14.0). There is no interaction effect between seeding age and planting density on growth, paddy yield and yield components, straw yield, and harvest index by ANOVA. However, seedling age had significant effect on plant length, stem number/m2 and headings; while planting density had a significant effect on the number of stems/m2, panicles/m2, and spikelets/panicle. Number of panicles/m2 had also a strong and significant relationship with paddy yield. In paddy yield estimated from yield components, A2D3 had a 5.4% advantage over A1D2, However, in Tsubo-Gari sampling, A1D2 outperformed in paddy and straw yield that reached up to 28.3% and 30.2%, respectively, and gave net benefit advantage between 978.35 to 2329.33 USD over alternatives. Applying A1D2 (14.5 hills/m2) decreased seedling cost/ha by 198.7 USD, increased milled rice by 0.98 ton/ha and net profit by 1982.05 USD over A2D3 (25.6 hills/m2). Therefore, treatment A1D2 confirmed as a better recommendation.
| Published in | Agriculture, Forestry and Fisheries (Volume 14, Issue 2) |
| DOI | 10.11648/j.aff.20251402.14 |
| Page(s) | 50-60 |
| Creative Commons |
This is an Open Access article, distributed under the terms of the Creative Commons Attribution 4.0 International License (http://creativecommons.org/licenses/by/4.0/), which permits unrestricted use, distribution and reproduction in any medium or format, provided the original work is properly cited. |
| Copyright |
Copyright © The Author(s), 2025. Published by Science Publishing Group |
Cost-benefit Analysis, Heading Date, NERICA 10, Planting Density, Seedling Age, Straw Yield, Tsubo-Gari Sampling
Seedling age (DAS) | Planting density | Label | |
|---|---|---|---|
Spacing (m) | (Hills/m2) | ||
21 | 0.3x0.23 | 14.5 | A1D1 |
0.25 x 0.2 | 20.0 | A1D2 | |
0.3 x 0.13 | 25.6 | A1D3 | |
28 | 0.3 x 0.23 | 14.5 | A2D1 |
0.25 x 0.2 | 20.0 | A2D2 | |
0.3 x 0.13 | 25.6 | A2D3 | |
Seedling age (DAS) | Planting density (hills/m2) | Days after transplanting (DAT) | |||||
|---|---|---|---|---|---|---|---|
16 | 34 | 51 | 61 | 72 | 79 | ||
21 | 14.5 | 31.2 | 55.9 | 83.9 | 107.6 | 112.2 | 112.3 |
20.0 | 30.2 | 56.4 | 82.4 | 106.1 | 109.0 | 109.6 | |
25.6 | 31.6 | 56.5 | 82.3 | 105.5 | 108.4 | 108.3 | |
28 | 14.5 | 33.9 | 57.1 | 85.3 | 106.8 | 110.6 | 111.9 |
20.0 | 35.1 | 56.9 | 83.6 | 104.8 | 107.2 | 106.9 | |
25.6 | 33.4 | 57.2 | 84.0 | 104.8 | 107.1 | 108.0 | |
21 | 31.6 b | 56.4 | 82.9 | 106.3 | 109.6 | 109.7 | |
28 | 36.0 a | 57.3 | 85.3 | 106.8 | 108.9 | 109.4 | |
14.5 | 33.0 | 57.2 | 83.0 | 105.8 | 108.5 | 109.4 | |
20.0 | 31.1 | 56.5 | 82.1 | 104.7 | 108.1 | 108.5 | |
25.6 | 32.4 | 56.3 | 82.7 | 104.9 | 109.1 | 109.6 | |
P value | |||||||
ANOVA | Age | 0.0093 | 0.0558 | 0.1543 | 0.3437 | 0.0558 | 0.4238 |
Density | 0.9908 | 0.7459 | 0.3160 | 0.2036 | 0.7459 | 0.0674 | |
Age x Density | 0.4287 | 0.7895 | 0.9481 | 0.9661 | 0.7895 | 0.7227 | |
Block | 0.2088 | 0.1151 | 0.2854 | 0.0803 | 0.1151 | 0.2398 | |
Seedling age (DAS) | Planting density (hills/m2) | Days after transplanting (DAT) | |||||
|---|---|---|---|---|---|---|---|
16 | 34 | 51 | 61 | 72 | 79 | ||
21 | 14.5 | 70 | 240 | 240 | 219 | 214 | 208 |
20.0 | 93 | 301 | 292 | 254 | 243 | 251 | |
25.6 | 105 | 312 | 280 | 256 | 249 | 246 | |
28 | 14.5 | 73 | 235 | 222 | 207 | 208 | 207 |
20.0 | 129 | 282 | 257 | 243 | 239 | 237 | |
25.6 | 134 | 333 | 297 | 266 | 265 | 266 | |
21 | 90b | 284 | 271 | 243 | 236 | 235 | |
28 | 111a | 283 | 259 | 239 | 237 | 237 | |
14.5 | 71 | 238 b | 231 c | 213 c | 211 c | 207 c | |
20.0 | 111 | 292 ab | 274 b | 249 b | 241 b | 243 b | |
25.6 | 120 | 322 a | 289 a | 261 a | 256 a | 256 a | |
P value | |||||||
ANOVA | Age | 0.0058 | 0.8623 | 0.1895 | 0.5452 | 1.000 | 1.000 |
Density | 0.0987 | 0.0037 | 0.0002 | 0.0001 | 0.0001 | 0.0001 | |
Age x Density | 0.1411 | 0.602 | 0.2301 | 0.6017 | 0.6283 | 0.2578 | |
Block | 0.0005 | 0.0615 | 0.5123 | 0.0973 | 0.6895 | 0.4409 | |
Seedling age (DAS) | Planting density (hills/m2) | Days after transplanting (DAT) | |||||
|---|---|---|---|---|---|---|---|
16 | 34 | 51 | 61 | 72 | 79 | ||
21 | 14.5 | 4.5 | 5.8 | 6.0 | 6.1 | 4.2 | 3.5 |
20.0 | 4.3 | 5.6 | 6.3 | 5.4 | 4.5 | 3.4 | |
25.6 | 4.1 | 5.6 | 6.0 | 5.8 | 4.0 | 3.5 | |
28 | 14.5 | 4.0 | 5.6 | 6.1 | 5.6 | 4.1 | 3.3 |
20.0 | 4.1 | 5.7 | 6.1 | 5.8 | 4.3 | 3.5 | |
25.6 | 5.0 | 5.5 | 6.0 | 6.0 | 3.9 | 3.5 | |
21 | 4.3 | 5.7 | 6.1 | 5.8 | 4.2 | 3.5 | |
28 | 4.4 | 5.6 | 6.0 | 5.8 | 4.1 | 3.4 | |
14.5 | 4.3 | 5.7 | 6.0 | 5.8 | 4.1 | 3.4 | |
20.0 | 4.2 | 5.7 | 6.2 | 5.6 | 4.4 | 3.4 | |
25.6 | 4.5 | 5.6 | 6.0 | 5.9 | 3.9 | 3.5 | |
P value | |||||||
ANOVA | Age | 0.0937 | 0.8867 | 0.7121 | 0.5138 | 0.3367 | 0.0910 |
Density | 0.4781 | 0.1435 | 0.3517 | 0.9173 | 0.3366 | 0.9884 | |
Age x Density | 0.7011 | 0.4800 | 0.4469 | 0.9685 | 0.3958 | 0.4295 | |
Block | 0.8012 | 0.4889 | 0.1353 | 0.1057 | 0.0285 | 0.1900 | |
Seedling age (DAS) | Planting density (hills/m2) | 10% heading | 50% heading | 90% heading |
|---|---|---|---|---|
21 | 14.5 | 55.7 | 59.3 | 62.7 |
20.0 | 55.7 | 60.0 | 63.0 | |
25.6 | 54.3 | 58.0 | 62.3 | |
28 | 14.5 | 54.3 | 58.0 | 59.7 |
20.0 | 54.0 | 57.3 | 59.3 | |
25.6 | 54.0 | 57.0 | 59.3 | |
21 | 55.2b | 59.1b | 62.7b | |
28 | 54.1a | 57.4a | 59.4a | |
14.5 | 55.0 | 58.7 | 61.2 | |
20.0 | 54.8 | 58.7 | 61.2 | |
25.6 | 54.2 | 57.5 | 60.8 | |
ANOVA | P value | |||
Age | 0.0050 | 0.0428 | 0.0062 | |
Density | 0.1160 | 0.3488 | 0.9452 | |
Age x Density | 0.2373 | 0.6196 | 0.9452 | |
Block | 0.1160 | 0.1226 | 0.1498 |
Seedling age (DAS) | Planting density (hills/m2) | Panicle number/ m2 | Spicklet number/Panicle | Ripening ratio (%) | 1000 grain weight (g) | Grain yield (t/ha) (%) | |
|---|---|---|---|---|---|---|---|
21 | 14.5 | 189 | 137 | 67.2 | 28.6 | 4.97 | (91.7) |
20.0 | 238 | 122 | 64.5 | 28.8 | 5.42 | (100) | |
25.6 | 259 | 113 | 63.7 | 28.7 | 5.35 | (98.7) | |
28 | 14.5 | 203 | 143 | 64.1 | 28.3 | 5.25 | (96.9) |
20.0 | 228 | 130 | 66.7 | 28.9 | 5.66 | (104.4) | |
25.6 | 251 | 119 | 66.9 | 28.6 | 5.71 | (105.4) | |
21 | 229 | 124 | 65.1 | 28.7 | 5.25 | (100) | |
28 | 227 | 131 | 65.9 | 28.6 | 5.54 | (105.5) | |
14.5 | 196 b | 140 a | 65.7a | 28.4a | 5.11 | (92.2) | |
20.0 | 233 a | 126 ab | 65.6a | 28.9a | 5.54 | (100) | |
25.6 | 255 a | 116 b | 65.3a | 28.7a | 5.53 | (99.8) | |
ANOVA | P value | ||||||
Age | 0.8748 | 0.2019 | 0.6545 | 0.0885 | 0.2944 | ||
Density | 0.0011 | 0.0077 | 0.9812 | 0.1926 | 0.3511 | ||
Age x Density | 0.59.63 | 0.9912 | 0.2970 | 0.6238 | 0.9851 | ||
Block | 0.9609 | 0.1902 | 0.5488 | 0.2341 | 0.5441 | ||
Parameters | r | p value |
|---|---|---|
Number of panicles /m2 | 0.577 | 0.0122 |
Number of spikelets/ panicle | 0.141 | 0.5761 |
Ripening ratio (%) | 0.114 | 0.6529 |
1000 grain weight (g) | 0.059 | 0.8161 |
Seedling age (DAS) | Planting density (hills/m2) | Grain yield (t/ha) (%) | Straw yield (t/ha) (%) | Harvest Index | ||
|---|---|---|---|---|---|---|
21 | 14.5 | 6.09 | (86.9) | 5.04 | (95.8) | 0.45 |
20.0 | 7.01 | (100) | 5.26 | (100) | 0.42 | |
25.6 | 5.81 | (82.9) | 3.80 | (72.2) | 0.40 | |
28 | 14.5 | 5.03 | (71.8) | 3.67 | (69.8) | 0.42 |
20.0 | 5.95 | (84.9) | 4.77 | (90.7) | 0.44 | |
25.6 | 5.61 | (80.0) | 4.11 | (78.1) | 0.42 | |
21 | 6.30 | (100) | 4.70 | (100) | 0.42 | |
28 | 5.53 | (87.8) | 4.18 | (88.9) | 0.43 | |
14.5 | 5.56 | (85.8) | 4.35 | (86.8) | 0.43 | |
20.0 | 6.48 | (100) | 5.01 | (100) | 0.43 | |
25.6 | 5.71 | (88.1) | 3.95 | (78.8) | 0.41 | |
ANOVA | P value | |||||
Age | 0.096 | 0.406 | 0.735 | |||
Density | 0.228 | 0.362 | 0.696 | |||
Age x Density | 0.651 | 0.550 | 0.561 | |||
Block | 0.284 | 0.130 | 0.063 | |||
Treatments | Grain yield (t/ha) | Milled yield (t/ha) | Gross Income (USD) | Production cost (USD) | Net Income (USD) |
|---|---|---|---|---|---|
A1D1 | 6.09 | 4.26 | 8358.82 | 3415.58 | 4943.24 |
A1D2 | 7.01 | 4.91 | 9621.57 | 3699.98 | 5921.59 |
A1D3 | 5.81 | 4.07 | 7974.51 | 3780.06 | 4194.45 |
A2D1 | 5.03 | 3.52 | 6903.92 | 3311.66 | 3592.26 |
A2D2 | 5.95 | 4.17 | 8166.67 | 3596.06 | 4570.61 |
A2D3 | 5.61 | 3.93 | 7700.00 | 3760.46 | 3939.54 |
ANOVA | Analysis of Variance |
DAS | Days After Sowing |
DAT | Days After Transplanting |
GAPs | Good Agricultural Practices |
RBD | Randomized Block Design |
SSA | Sub-Saharan Africa |
USD | United State Dollar |
| [1] | Wang, J., Han, M., Huang, Y., Zhao, J., Liu, C., and Ma, Y. Flooding Tolerance of Rice: Regulatory Pathways and Adaptive Mechanisms. Plants. 2024. |
| [2] | Weisskopf, A., Harvey, E., Kingwell-Banham, E., Kajale, M., Mohanty, R., and Fuller, DQ. Archaeobotanical implications of phytolith assemblages from cultivated rice systems, wild rice stands and macro-regional patterns. Journal of Archaeological Science.2014. |
| [3] | Luo, W., Chen, M., Kang, Y., Li, W., Li, D., Cui, Y., Khan, S., and Luo. Y. Analysis of crop water requirements and irrigation demands for rice: Implications for increasing effective rainfall. Agricultural Water Management.2022. |
| [4] | Arouna, A., Fatognon, IK., Saito, K., Futakuchi, K. Moving toward rice self-sufficiency in sub-Saharan Africa by 2030: Lessons learned from 10 years of the Coalition for African Rice Development. World Development Perspectives. 2021. |
| [5] | Li, P., Chen, YH. Lu, J., Zhang, CQ, Liu, QQ., and Li, QF. Genes and Their Molecular Functions Determining Seed Structure, Components, and Quality of Rice.2022. |
| [6] | Fujiie, H., and Suzuki, F. How has Rice Production in Sub-Saharan Africa Expanded? A Comparison of Growth Rates Before and After CARD Implementation and the Case of Tanzania, JICA Ogata Research Institute. 2024 |
| [7] | FAOSTAT. Food and Agriculture Organization Corporate Statistical Database. 2024. |
| [8] | Saito, K., Senthilkumar, K., Dossou-Yovo, E., Ali, I., Johnson, JM., Mujawamariya, G. and Rodenburg, J. Status quo and challenges of rice production in Sub Saharan Africa, Plant Production Science.2023. |
| [9] | Senthilkumar, k. Closing rice yield gaps in Africa requires integration of good agricultural practices. Field Crops Research. 2022. |
| [10] | Diyoprakuso, F., Suryanto, A., and Soelistyono, R. The Effect of Planting Time and Plant Density on Radiation Use Efficiency (RUE) on Lowland Rice (Oryza sativa L.) Cv. Inpari 30. 2022. |
| [11] | Abookheili, F. A., and Mobasser, H. R. Effect of planting density on growth characteristics and grain yield increase in successive cultivations of two rice cultivars. Geosystems, Geosciences & Environment. 2021. |
| [12] | Yu-xiang, L., Yang, L, Yu-hui, W., Yan-feng, D., Shao-hua, W., Zheng-hui, L., and Ganghua, L. Effects of seedling age on the growth stage and yield formation of hydroponically grown long-mat rice seedlings. Journal of Integrative Agriculture. 2020. |
| [13] | Sah, MK., Shrestha, A., Shah, P., and Mishra, A. Impact of Age of Seeding and Varieties on Yield and Yield Attributing Characters of Rice in Central Terai Region of Nepal. Agronomy Journal of Nepal. 2023. |
| [14] | Mupeta, I Susuwele, C., Nkumbe, N. C. The Effect of Seedling Age on Growth and Yield of NERICA4 Rice. Asian Journal of Agriculture and Food Sciences. 2022. |
APA Style
Beyene, A. M. (2025). Evaluating the Agronomic and Economic Yield of Rice: An Effective Way for Delivering Extension Service. Agriculture, Forestry and Fisheries, 14(2), 50-60. https://doi.org/10.11648/j.aff.20251402.14
ACS Style
Beyene, A. M. Evaluating the Agronomic and Economic Yield of Rice: An Effective Way for Delivering Extension Service. Agric. For. Fish. 2025, 14(2), 50-60. doi: 10.11648/j.aff.20251402.14
@article{10.11648/j.aff.20251402.14,
  author = {Adane Melak Beyene},
  title = {Evaluating the Agronomic and Economic Yield of Rice: An Effective Way for Delivering Extension Service
},
  journal = {Agriculture, Forestry and Fisheries},
  volume = {14},
  number = {2},
  pages = {50-60},
  doi = {10.11648/j.aff.20251402.14},
  url = {https://doi.org/10.11648/j.aff.20251402.14},
  eprint = {https://article.sciencepublishinggroup.com/pdf/10.11648.j.aff.20251402.14},
  abstract = {Africa has experienced the fastest-growing demand for rice in the world over the past decade, making rice remarkable economic and social importance. However, compared to other rice-growing regions, Africa's rice yields are among the lowest, with imports meeting most of the demand. Yield improvement can be achieved by adjusting elements of the cropping system, such as planting date and density. Therefore, this experiment aims to determine the proper seedling age and optimum planting density of NERICA 10 for maximum grain and straw yields as well as high net profit. The experiment was conducted using a factorial randomized block design with three replications. Seedling age of 21 and 28 days after sowing (DAS) and planting density of 14.5, 20.0, and 25.6 hills/m2 were used as factors. Plant length, stem number, leaf color, heading date, paddy yield, yield components, and straw yield were measured. Data were analyzed using Microsoft Excel and JMP (ver.14.0). There is no interaction effect between seeding age and planting density on growth, paddy yield and yield components, straw yield, and harvest index by ANOVA. However, seedling age had significant effect on plant length, stem number/m2 and headings; while planting density had a significant effect on the number of stems/m2, panicles/m2, and spikelets/panicle. Number of panicles/m2 had also a strong and significant relationship with paddy yield. In paddy yield estimated from yield components, A2D3 had a 5.4% advantage over A1D2, However, in Tsubo-Gari sampling, A1D2 outperformed in paddy and straw yield that reached up to 28.3% and 30.2%, respectively, and gave net benefit advantage between 978.35 to 2329.33 USD over alternatives. Applying A1D2 (14.5 hills/m2) decreased seedling cost/ha by 198.7 USD, increased milled rice by 0.98 ton/ha and net profit by 1982.05 USD over A2D3 (25.6 hills/m2). Therefore, treatment A1D2 confirmed as a better recommendation.
},
 year = {2025}
}
TY  - JOUR
T1  - Evaluating the Agronomic and Economic Yield of Rice: An Effective Way for Delivering Extension Service

AU  - Adane Melak Beyene
Y1  - 2025/04/19
PY  - 2025
N1  - https://doi.org/10.11648/j.aff.20251402.14
DO  - 10.11648/j.aff.20251402.14
T2  - Agriculture, Forestry and Fisheries
JF  - Agriculture, Forestry and Fisheries
JO  - Agriculture, Forestry and Fisheries
SP  - 50
EP  - 60
PB  - Science Publishing Group
SN  - 2328-5648
UR  - https://doi.org/10.11648/j.aff.20251402.14
AB  - Africa has experienced the fastest-growing demand for rice in the world over the past decade, making rice remarkable economic and social importance. However, compared to other rice-growing regions, Africa's rice yields are among the lowest, with imports meeting most of the demand. Yield improvement can be achieved by adjusting elements of the cropping system, such as planting date and density. Therefore, this experiment aims to determine the proper seedling age and optimum planting density of NERICA 10 for maximum grain and straw yields as well as high net profit. The experiment was conducted using a factorial randomized block design with three replications. Seedling age of 21 and 28 days after sowing (DAS) and planting density of 14.5, 20.0, and 25.6 hills/m2 were used as factors. Plant length, stem number, leaf color, heading date, paddy yield, yield components, and straw yield were measured. Data were analyzed using Microsoft Excel and JMP (ver.14.0). There is no interaction effect between seeding age and planting density on growth, paddy yield and yield components, straw yield, and harvest index by ANOVA. However, seedling age had significant effect on plant length, stem number/m2 and headings; while planting density had a significant effect on the number of stems/m2, panicles/m2, and spikelets/panicle. Number of panicles/m2 had also a strong and significant relationship with paddy yield. In paddy yield estimated from yield components, A2D3 had a 5.4% advantage over A1D2, However, in Tsubo-Gari sampling, A1D2 outperformed in paddy and straw yield that reached up to 28.3% and 30.2%, respectively, and gave net benefit advantage between 978.35 to 2329.33 USD over alternatives. Applying A1D2 (14.5 hills/m2) decreased seedling cost/ha by 198.7 USD, increased milled rice by 0.98 ton/ha and net profit by 1982.05 USD over A2D3 (25.6 hills/m2). Therefore, treatment A1D2 confirmed as a better recommendation.

VL  - 14
IS  - 2
ER  -
Ethiopian Institute of Agricultural Research (EIAR), Fogera National Rice Research and Training Center (FNRRTC), Woreta, Ethiopia
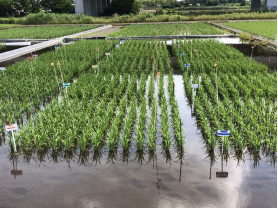
Figure 1. Applying herbicide and maintaining water at 5cm depth.
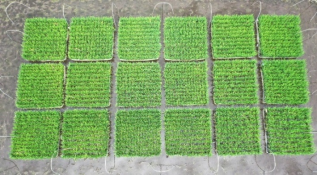
Figure 2. Performance of the experiment; picture taken by drone on 10 June, 2024.
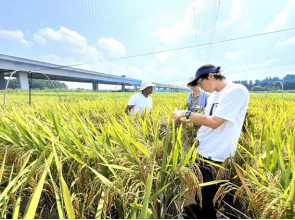
Figure 3. Sample collection to determine yield components.
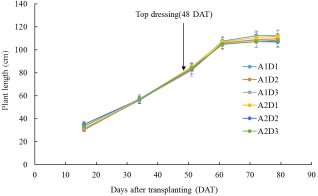
Figure 4. Plant length.
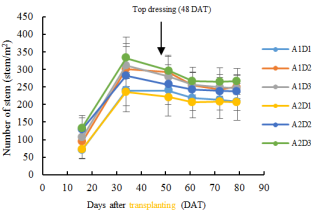
Figure 5. Stem number per meter square.
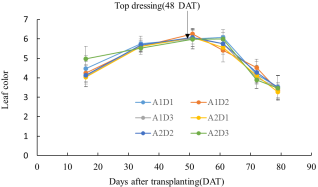
Figure 6. Leaf color.
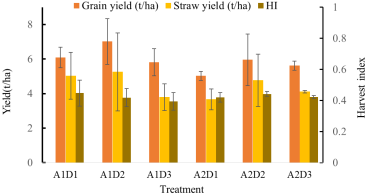
Figure 7. Grain and straw yield and harvest index by treatment.